
Every automation pitch deck opens the same way: there aren’t enough warehouse workers, so you need machines. The number below says something different, and it is more useful.
The number
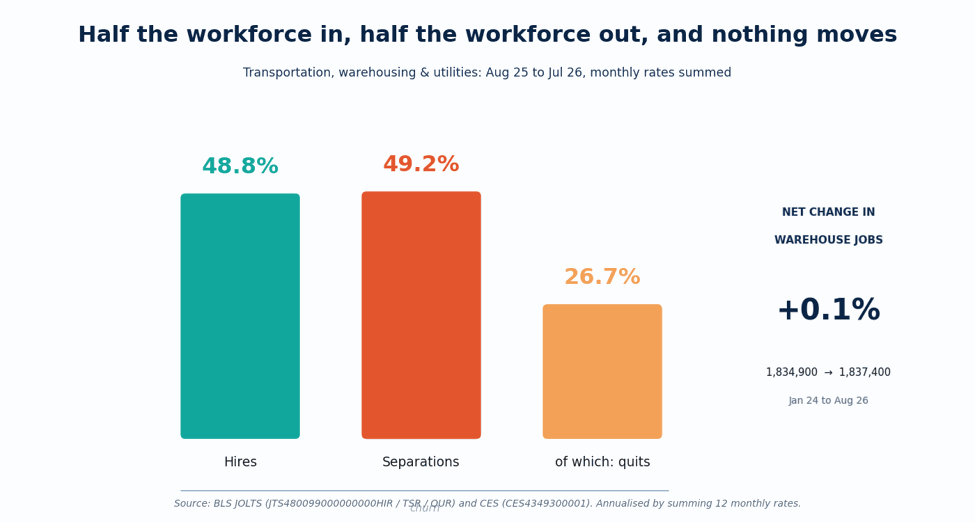
Take the Bureau of Labor Statistics JOLTS series for transportation, warehousing and utilities, and sum the monthly rates across the twelve months to July 2026:
• Hires: 48.8% of employment
• Total separations: 49.2% of employment
• Of those separations, voluntary quits alone: 26.7%
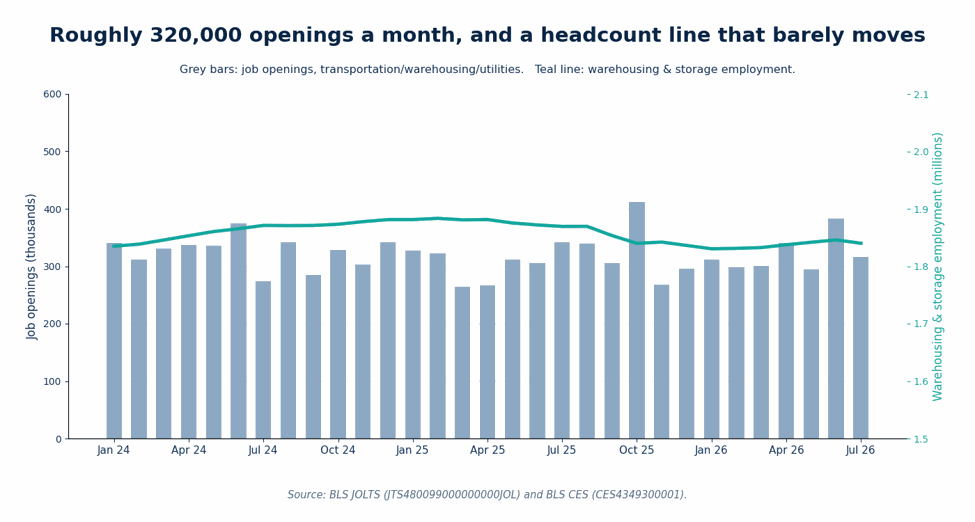
• Job openings: 316,000 in July 2026, averaging 322,000 a month across the year
Now the other side. Warehousing and storage employment (BLS CES, NAICS 493) was 1,837,400 in August 2026, against 1,834,900 in January 2024. Two and a half years, +0.1%.
The sector hired roughly half its workforce and lost roughly half its workforce to move employment by a tenth of a percent.
That is not a shortage. That is a turnstile.
The two lines that never separate
Plot the monthly rates and the point becomes visual. Hires and separations move together, month after month, with quits running at a little over 2% a month underneath them. There is no period in the window where hiring pulls meaningfully ahead of leaving.
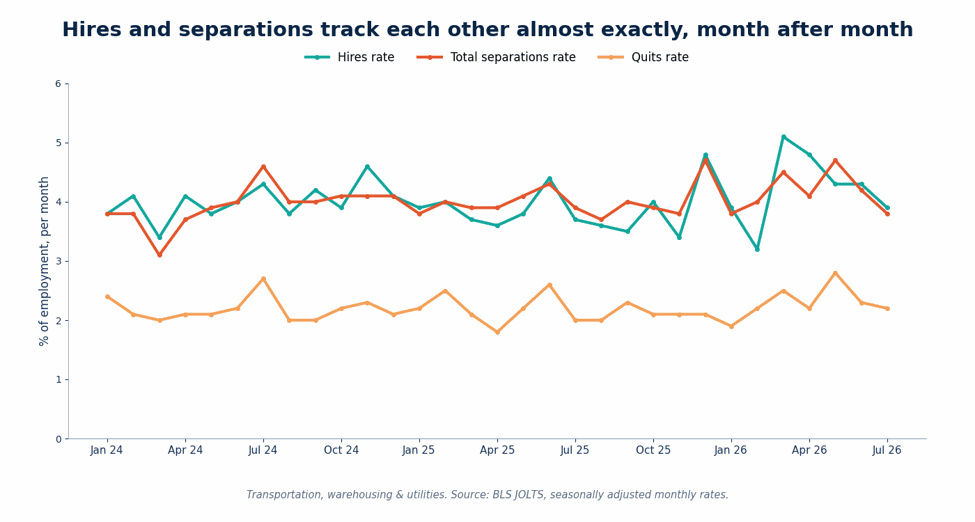
This matters because the two rates are usually reported separately and in isolation. A press release about record hiring in logistics is not good news if the separations line is sitting on top of it.
Openings don’t explain it either
The sector advertises around 320,000 open jobs a month. If those openings represented unmet demand for labour in a growing workforce, you would expect the employment line to climb as they were filled. It doesn’t. The openings persist at roughly the same level while headcount stays flat, which is what a permanent refill queue looks like rather than a growth queue.
The bucket, not the tap
The operational reading is simple. Recruiting is not the binding constraint. Retention is. Almost every hire is spent replacing someone who left, so the recruiting function is running at near-full capacity just to keep the workforce level, and it produces very little additional capacity for the business.
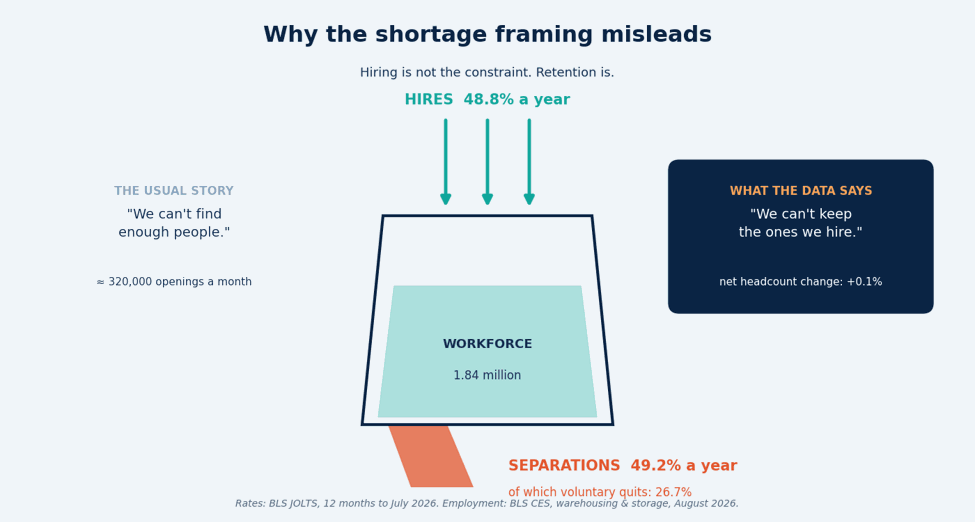
This also explains a pattern most warehouse managers recognise but rarely quantify: a large share of the people on the floor on any given day are in their first few months. Training cost, pick error rates, damage rates and injury risk all skew toward short-tenure workers, so high churn does not just cost recruiting fees. It permanently degrades the quality of the operation.
What it changes about the automation business case
Reframing the labour problem from shortage to churn changes three things in the investment case for robots, AMRs, drones and AI vision.
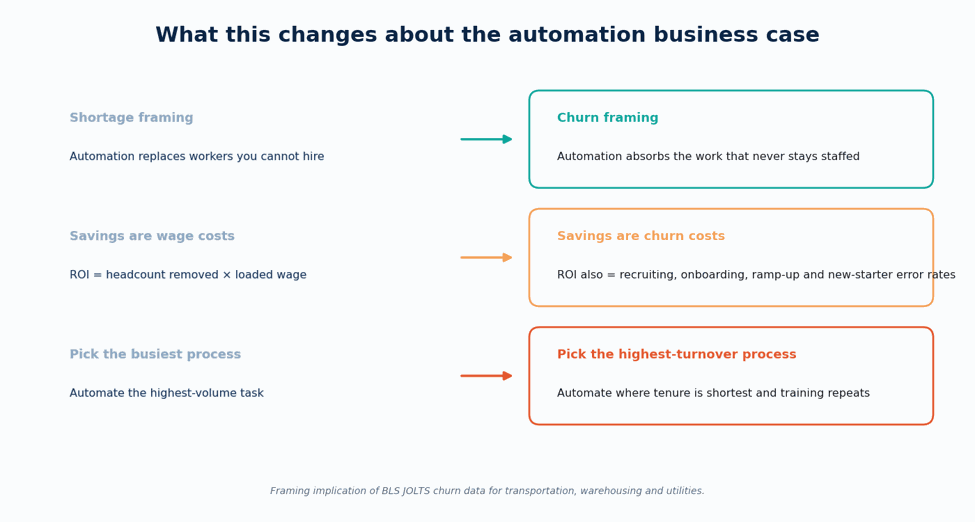
1. What the machines are competing with
They are not competing with a stable, experienced workforce. They are competing with a role that, sector-wide, turns over about once a year. That is a much lower bar, and it makes the comparison far more favourable for automation on consistency alone.
2. What the savings actually are
A business case built only on wages understates the return. The real comparison includes recruiting cost, onboarding and training, the ramp-up period before a new starter hits standard rate, and the higher error and incident rates during that ramp. Those costs recur with every replacement, which in this sector is roughly annually per role.
3. Where to automate first
The default heuristic is to automate the highest-volume task. The churn data suggests a better one: automate where tenure is shortest. The process that burns through people the fastest is the process where you are paying the training cost over and over, and it is usually also the process people leave because of.
Reproduce it in ten lines
Nothing here needs a licence, a vendor report or a model. The BLS public API returns the series without a registration key for a short recent window (register a free key for the full history):
import json, urllib.request
IDS = ["JTS480099000000000HIR", # hires rate
"JTS480099000000000TSR", # total separations rate
"JTS480099000000000QUR", # quits rate
"JTS480099000000000JOL"] # job openings, thousands
req = urllib.request.Request(
"https://api.bls.gov/publicAPI/v1/timeseries/data/",
json.dumps({"seriesid": IDS}).encode(),
{"Content-Type": "application/json"})
res = json.load(urllib.request.urlopen(req))["Results"]["series"]
for s in res: # sum the last 12 monthly rates
vals = [float(d["value"]) for d in s["data"][:12]]
print(s["seriesID"], round(sum(vals), 1))
Swap the series list for `CES4349300001` to get warehousing and storage employment.
Honest limits
• The two datasets are not the same industry. JOLTS publishes churn at the transportation, warehousing and utilities level. The employment figure is warehousing and storage alone. The churn rate therefore covers more than warehouses, and the two should not be treated as one series.
• Summing twelve monthly rates is a derived figure, not a BLS-published annual rate. It is the standard way to annualise JOLTS, but it double-counts anyone hired and separated more than once in the year, so read it as churn volume rather than as “49% of individuals left”.
• Seasonal adjustment and revisions. JOLTS is a sample survey and is revised. Rates survive revision better than levels, which is part of why this framing uses them.
• Flat net headcount is not flat capacity. Hours, shift patterns and automation already deployed all change output without changing the employment line.
• No tenure data is public at this level. The claim that short-tenure workers carry higher error and injury rates is an operational observation, not something these three series can prove.
The measurement that would settle it
The public data can show the churn. It cannot show what the churn costs you. That sits in systems every operator already has: tenure at termination from HR, time-to-fill by requisition, and pick rate, error rate and incident rate joined to tenure from the WMS.
Join those three and you get the number that actually decides an automation investment: the cost per replacement cycle for each process, and therefore which process should be automated first. If someone has run that join on real warehouse data, I’d like to see it.
Data: BLS JOLTS and CES, retrieved via the BLS public API on 24 September 2026. Series: JTS480099000000000HIR, TSR, QUR, JOL; CES4349300001.
This article was originally published on Medium by Ponvannan P.